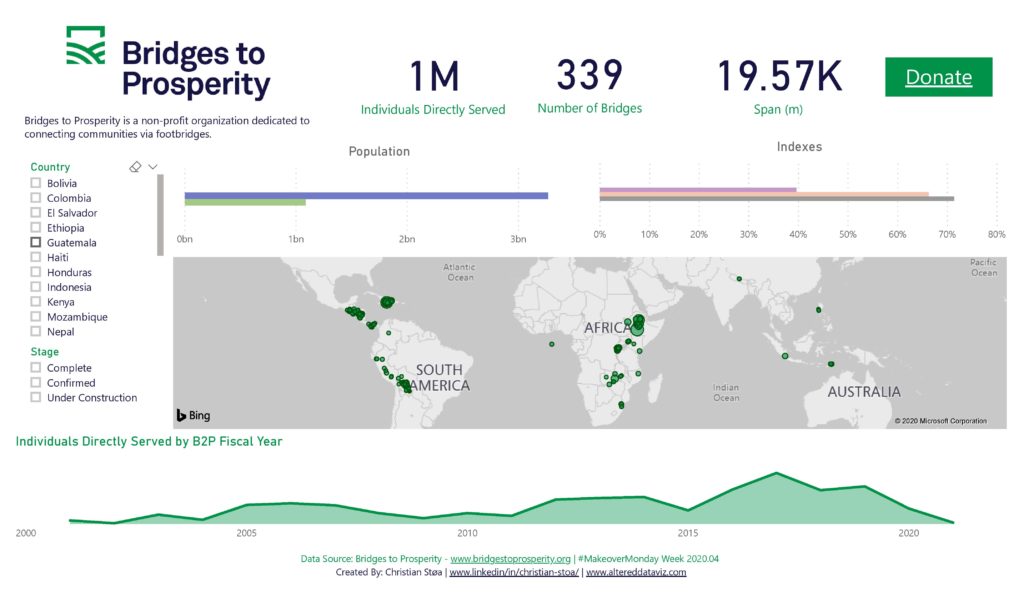
Week 4 of Makeover Monday. This week’s task is to put together a dashboard based on data provided by Bridge to Prosperity, a great non-profit that helps to build bridges in rural areas. I use Power BI as my visualization tool because it allows me to do my data transformations and relationships within in the app itself. #MakeoverMonday #PowerBI #BridgestoProsperity
https://bridgestoprosperity.org
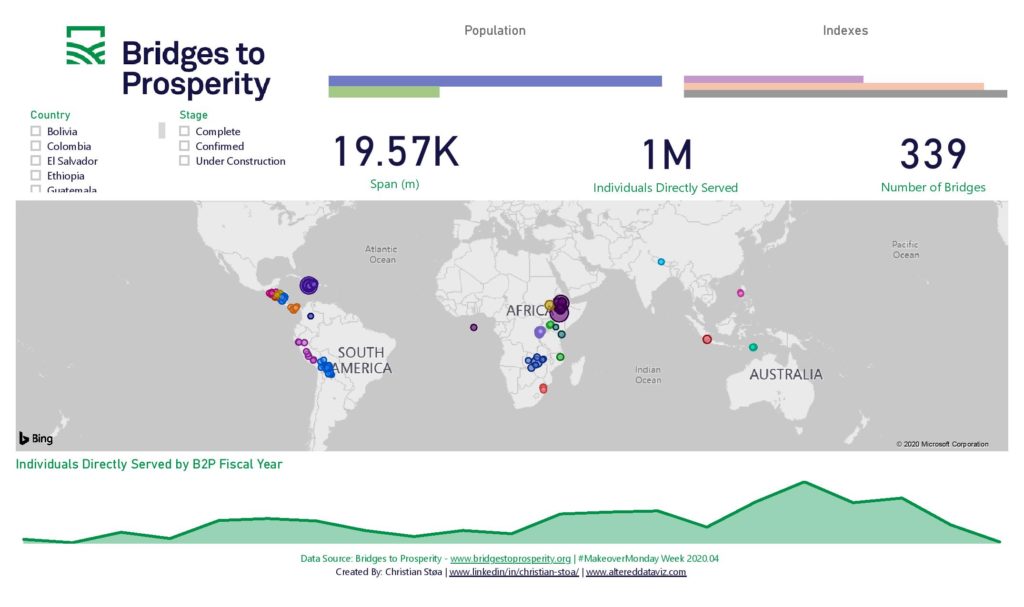
Version 2