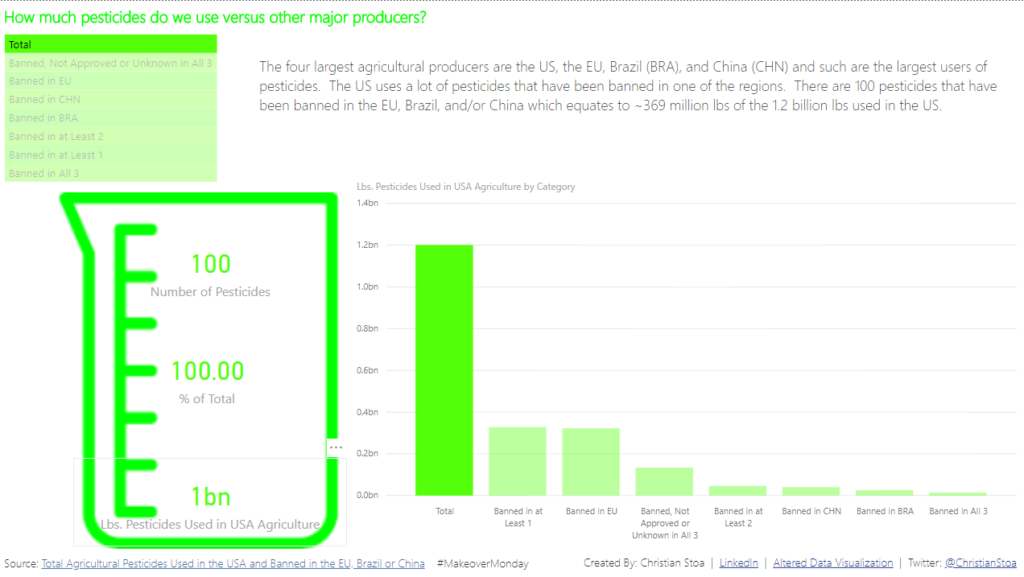
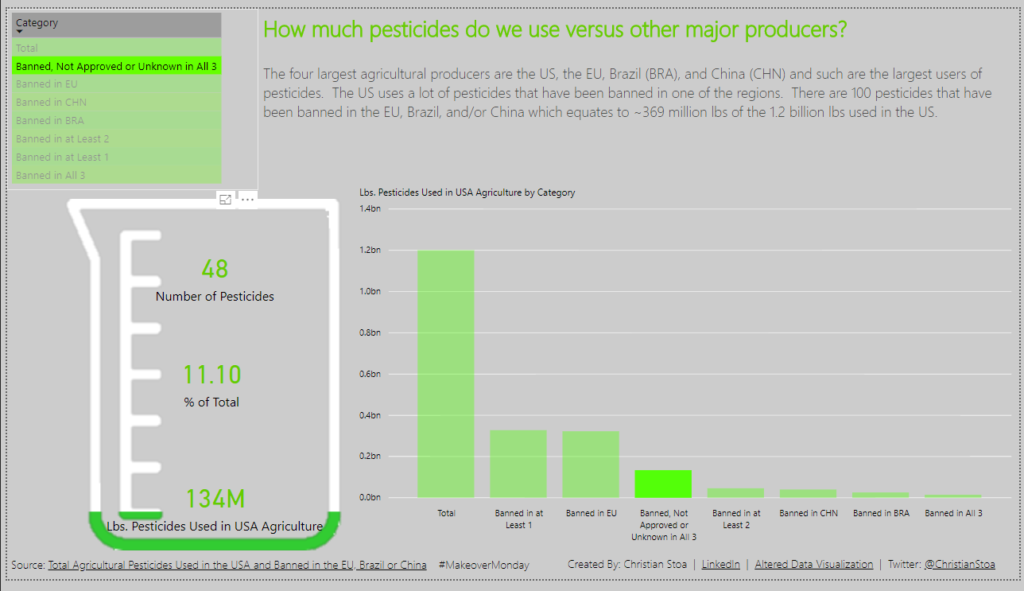
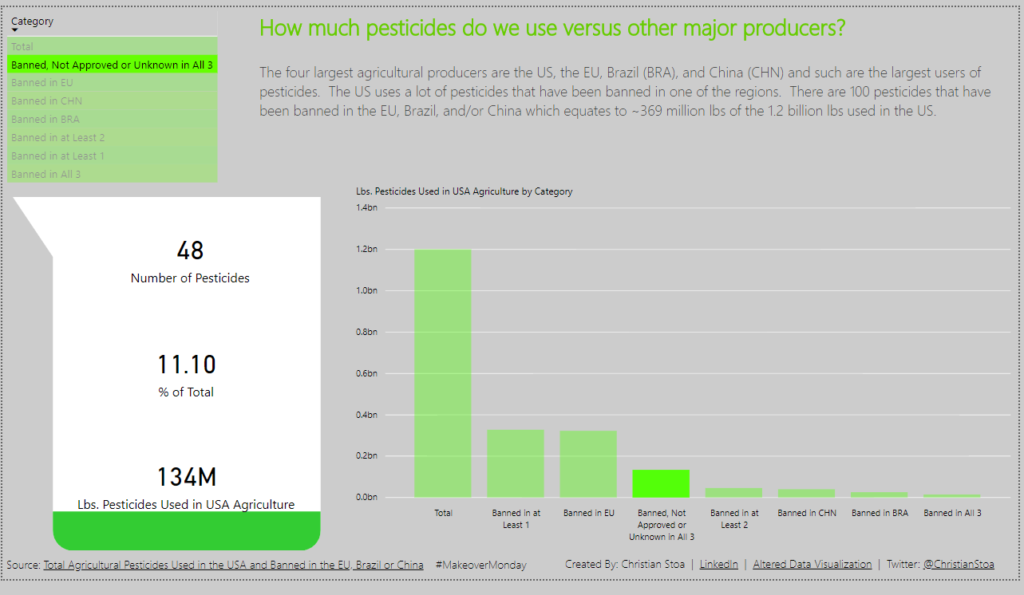
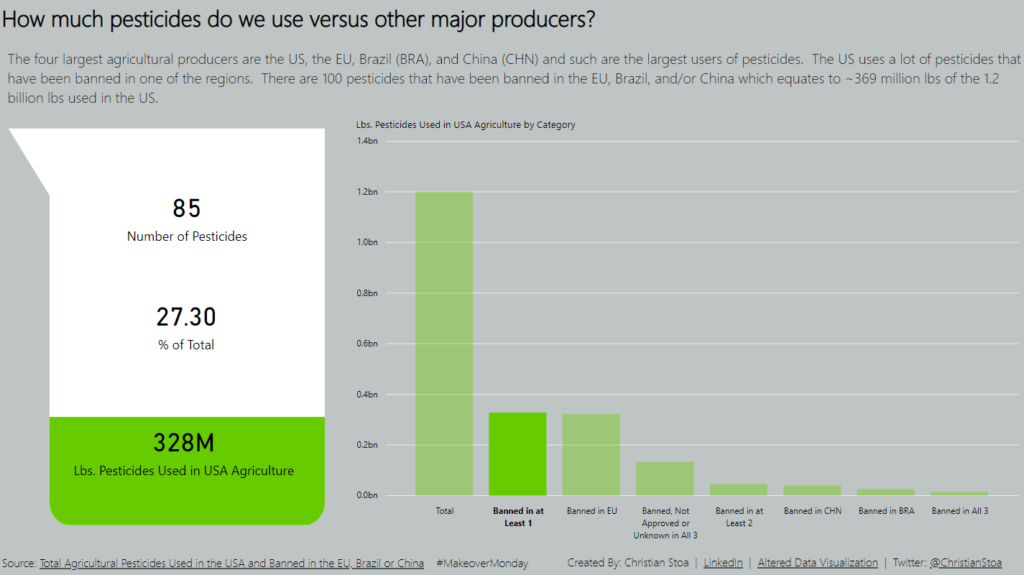
Week 2 of MakeOver Monday was about the US usage of pesticides and the ones that are banned in the EU, China, and Brazil. The original data set that was posted on the page was missing the number of pesticides, but someone had posted the full data set in the discussion section of the Data World post. I pulled in the pesticide counts and then I was good to go.
This time I went back to using Power BI because there is a great visuals from the marketplace called Infograph Designer. It is a great tool to do some fantastic visuals. I wanted to have a beaker in this one because of the chemical nature of the theme.
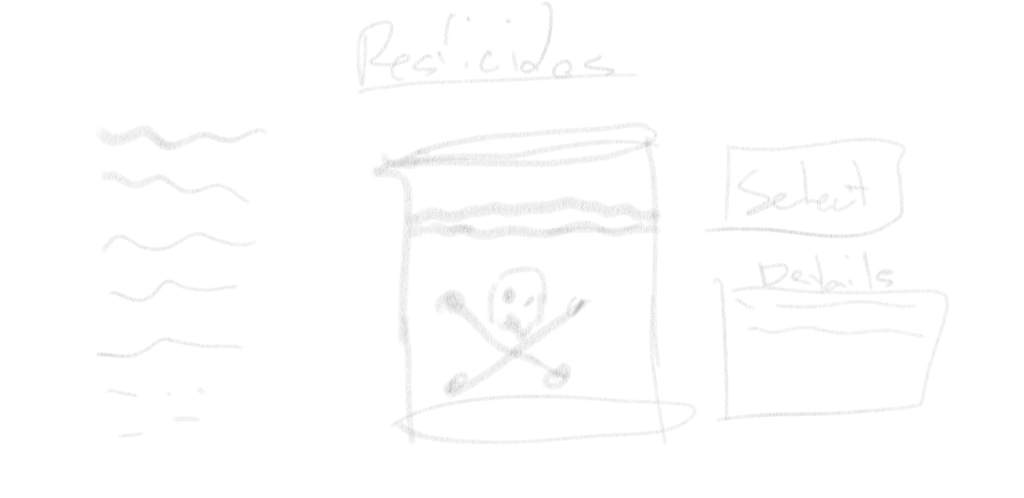
As usual I tend to always start with sketching out my design before I dive into making the full visualization.
It took a few different iterations to get to the end product.

There was some help from a follow data viz aficionado, Bruno Reis of The Data Must Flow. He was able to be a springboard for me and got me a vector based beaker.
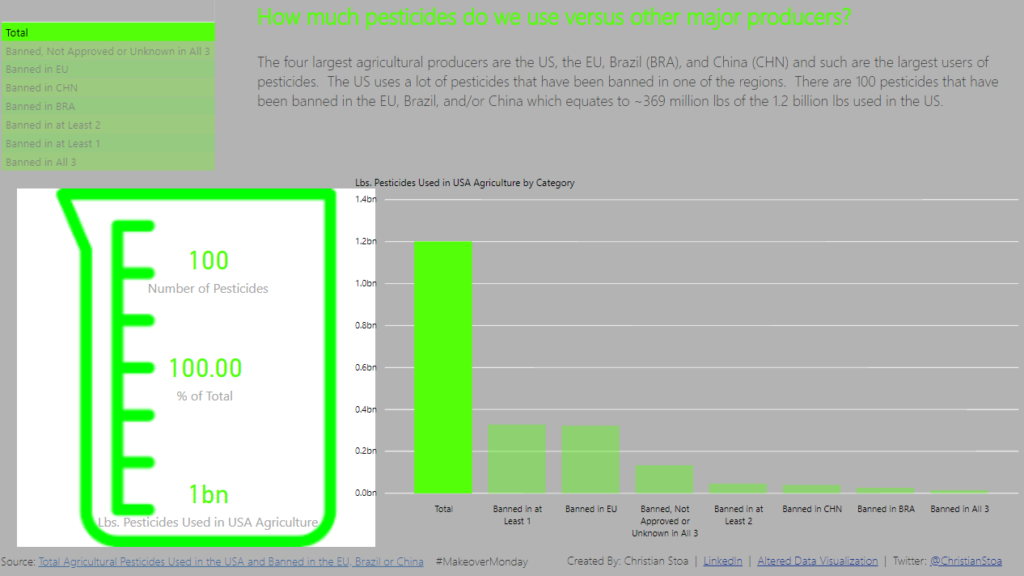
The final visual below has a minor flaw, but overall I am happy with it. If the bars are deselected then the beaker changes to beakers and doesn’t end up fitting in the space defined.
Great content! Super high-quality! Keep it up! 🙂
Thank you. Appreciate the feedback.